Resonant DNA

Electric detection of individual DNA molecules with a nanopore
Experimental system for detecting single DNA molecules with a nanopore. The insert shows a transmission electron micrograph of the pore sculptured by a highly focused electron beam (more).
The figure to your left illustrates schematically a system for measuring characteristic ionic currents for a pore that conducts DNA. A single nanopore separates two compartments filled with salt buffer and connected to Ag-AgCl electrodes. A constant voltage bias is applied between the two electrodes, inducing a steady-state ionic current through the pore, which is measured by the amplifier. Adding DNA to the negatively biased compartment is observed to cause transient reductions of the ionic current, like the one shown in the figure. This reduced conductance is associated with the translocation of DNA through the pore, which partially blocks the ionic current.
Using a similar set-up, Kasianowicz and co-workers (![PNAS. 93:13770]](https://lh3.googleusercontent.com/blogger_img_proxy/AEn0k_sjvultF9S-ttrP3AjAlORr6oWF0XFiXwTv_dhPyJggJVZ4oSy6ghFrVFnVPedL-9pz0DQV8A-gwQ9Bs2Dqr8JEfajQ53z1vGAwUArkk6N8P2jr_OdrPB_ShvicIEw=s0-d) ) measured, for the first time, the blockage currents of single-stranded RNA and DNA electrophoretically driven through the transmembrane pore of an alpha-hemolysin channel, which was suspended in a lipid bilayer. Statistical analysis of many such blockage currents allowed the researchers to discriminate different sequences of RNA () and DNA () homopolymers, as well as the segments of purine and pyrimidine nucleotides within a single RNA molecule (). A single nucleotide resolution has been demonstrated for DNA hairpins (, ), raising the prospect of creating a nanopore sensor capable of reading the nucleotide sequence directly from a DNA or RNA strand. Recent advances in semiconductor nanotechnology allow one to manufacture pores with nanometer-size diameters using highly focused ion () and electron (, , ) beams. These nanopores have been used as Coulter counter devices for detecting single DNA molecules, resolving their length and diameter. So-called ionic current blockades measured for synthetic nanopores differ from their alpha-hemolysin analogs. For synthetic nanopores observed blockades presently show irregular shapes due to fluctuations of the reduced current within one blockade event; some blockades have a positive spike of the ionic current above the open pore level at the end of the blockade.
) measured, for the first time, the blockage currents of single-stranded RNA and DNA electrophoretically driven through the transmembrane pore of an alpha-hemolysin channel, which was suspended in a lipid bilayer. Statistical analysis of many such blockage currents allowed the researchers to discriminate different sequences of RNA () and DNA () homopolymers, as well as the segments of purine and pyrimidine nucleotides within a single RNA molecule (). A single nucleotide resolution has been demonstrated for DNA hairpins (, ), raising the prospect of creating a nanopore sensor capable of reading the nucleotide sequence directly from a DNA or RNA strand. Recent advances in semiconductor nanotechnology allow one to manufacture pores with nanometer-size diameters using highly focused ion () and electron (, , ) beams. These nanopores have been used as Coulter counter devices for detecting single DNA molecules, resolving their length and diameter. So-called ionic current blockades measured for synthetic nanopores differ from their alpha-hemolysin analogs. For synthetic nanopores observed blockades presently show irregular shapes due to fluctuations of the reduced current within one blockade event; some blockades have a positive spike of the ionic current above the open pore level at the end of the blockade.
Setting up an MD simulation
Sequencing DNA strands with a nanopore device has not been achieved yet. As A, C, G, and T DNA nucleotides differ from each other by only a few atoms, in order to relate the sequence of DNA to the measured electrical signals, it is essential to characterize the conformations of DNA inside the pore in atomic detail. At present, MD is the only methodology that can provide realistic images of microscopic events taking place inside the nanopore. Atom by atom, we build microscopic models of the experimental systems and simulate, adapting the methodology developed by us for membrane proteins, translocation of DNA through pores in synthetic membranes. The figure below illustrates a typical procedure for setting up an MD simulation of DNA translocation through a silicon nitride pore.

To construct a microscopic model of a nanopore, we first build a silicon nitride membrane by replicating a unit cell of a beta-silicon nitride crystal (1) and (2). By removing atoms from the silicon nitride membrane, we produce pores of symmetric double-conical (hourglass) shapes with radii that correspond to experiment (3). After placing a DNA molecule in front of the pore, we add water and ions on both sides of the membrane (4). The final systems measure from 10 to 30~nm in the direction normal to the membrane and include up to 200,000 atoms. To accomplish MD simulations on a system comprising of DNA and silicon nitride, the molecular force field describing water, ions, and nucleic acids () is combined with the MSXX molecular force field for silicon nitride (). The protocols of the simulation are described in detail elsewhere (, ). When a uniform electrical field is applied to all atoms in our system, it induces, at the beginning of the simulation, a rearrangement of the ions and water that focuses the electrical field to the vicinity of the membrane, neutralizing the field in the bulk. The resulting voltage bias V across the simulated system depends both on the magnitude of the applied field E and the dimension Lz of the system in the direction of the field, i.e., V=-ELz; the electrostatic potential near the pore is not uniform (5). The gradient of this electrostatic potential drives DNA through the nanopore (6).
Translocation of double stranded DNA (dsDNA) through Si3N4 pores
DNA - nanopore interaction reduces the ionic current

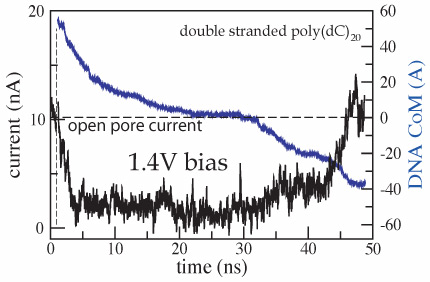
Applying a 1.3~V (or larger) bias over a 5.2-nm-thick membrane we can observe, within the time scale of a MD simulation, a full permeation of a short (20-60 base pairs) DNA fragment through nanopores. A typical translocation event is illustrated by movie. At the beginning of the simulation, a 20 base pair fragment of dsDNA is placed in front of a 2.2x2.6 nm2 pore. Within the first 2~ns, the end of DNA nearest to the pore is pulled into the pore by its charged backbone. The rest of the molecule follows that end, which, after 4 ns, encounters the narrowest part of the pore. At this point, the terminal Watson-Crick base-pair splits, and the freed nucleotides adhere with their bases to the surface of the pore. The translocation proceeds further until it halts after 20~ns. At this point, the three Watson-Crick base-pairs that were first to enter the pore are split; one of the terminal bases continues to adhere strongly to the pore surface. The system is driven out of this metastable conformation by increasing the voltage bias from 1.4 to 4.4~V for 0.3~ns (approximately after 30~ns from the beginning of the simulation). Subsequently, the simulation was continued at a 1.4~V bias. DNA slowly exits the pore, while one of the bases holds firmly to the surface of the pore. After about 50~ns, most of the DNA has left the pore, but a few bases remain attached to the pore surface; nine of twenty base-pairs are split.

In addition to driving DNA through the nanopore, the electric field induces displacements of ions, forcing them to move through the pore in opposite directions. When DNA enters the pore, it reduces the ionic current; however, after the DNA translocation is completed, the ionic current recovers to the open pore level. The ionic current can be computed from a MD trajectory by summing up local displacements of all ions over a time interval Δt:

where zi and qi are the z coordinate and the charge of atom i, respectively; Lz is the length of the simulated system in the direction of the applied electric field (the z axis in our case); the sum runs over all ions ( ). In the figure we plot the ionic current (black) and the z coordinate of the DNA center of mass (blue) versus time for the MD trajectory illustrated by the movie. The very first part of the figure (time < 1 ns) corresponds to a simulation in which DNA does not block the ionic current. When DNA is placed in front of the pore, it is rapidly captured by the pore, which is reflected by the reduction of the ionic current. When DNA translocates through the membrane, the level of total ionic current appears to be correlated with the DNA velocity inside the pore: the faster DNA moves, the less it blocks the ionic current. The current returns to the open pore level after most of the DNA has left the pore, although some DNA remains inside the pore at the end of the simulation.
where zi and qi are the z coordinate and the charge of atom i, respectively; Lz is the length of the simulated system in the direction of the applied electric field (the z axis in our case); the sum runs over all ions (
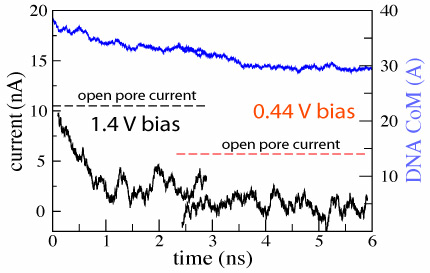
 d=2.4±0.2 nm; 1.4 V / 5.2 nm; 3 ns total( 1.5M) |  d=2.4±0.2 nm; 0.44 V / 5.2 nm; 4 ns total ( 1.8M) |  |
We have demonstrated so far that translocation of DNA through a synthetic nanopore results in a transient reduction of the ionic current. The reverse conjecture, i.e., that the transient reduction of the ionic current indicates DNA translocation through a nanopore, is not always valid. As the electrical field in the bulk of the electrolyte is zero, one can assume that DNA approaches the pore by diffusion, and, hence, the conformation in which DNA collides with the pore for the first time is random. Hence, the starting configuration in which DNA is placed in front of the pore normal to the surface of the membrane represents only a fraction of DNA's first encounters with the nanopore. The other extreme case would be for DNA to approach the pore in the conformation shown above, i.e., parallel to the surface of the membrane. We started our next simulation from such conformation, placing the same 20 base pair fragment of dsDNA 12 A away from the membrane. Within 3 ns, a 1.4 V bias drove DNA into the mouth of the pore (movie). The ionic current was observed to drop by 75%, which is comparable to the level of the current blockade when DNA permeates the pore (figure). Thus, by comparing the results of the two MD simulations, we learn that large blockades of the ionic current do not necessarily indicate DNA translocation through a synthetic nanopore, implying that the ionic current readout is ambiguous in the case of synthetic nanopores. This apparent ambiguity can be resolved when instead of a silicon nitride membrane, the pore is made in a multi-layered silicon wafer, in which a thin layer of silicon dioxide is sandwiched between two layers of doped silicon. When DNA is driven through such a pore, it produces two independent voltage signals in the doped silicon layers, allowing one to unambiguously differentiate translocation of DNA from the obstruction of the pore mouth ().
Threshold diameter for translocation of dsDNA is 2.5 nm at small fields
To find out what is the smallest pore dsDNA could translocate through, we simulated the 1.4 (movie), 2.0 (movie), and 3.0 (movie) nm diameter pores combined with one 58-bp dsDNA helix. To shorten the translocation times to a practical duration, the simulations were done at 1.3 V. As a reference point for DNA movement through a pore, we use the DNA center of mass (CoM). Although describing the conformation of a 58-bp DNA helix using a single variable can be ambiguous, in our case, CoM faithfully illustrates the DNA permeation through a pore: when DNA fails to permeate the pore, its conformation is similar to that of a canonical double helix, whereas when DNA permeates the pore, the changes of the CoM position are much bigger than the shift of the CoM due to stretching, bending, or partial unzipping of the double helix.
 |  d = 2.0 nm; 1.4 V / 10.2 nm; 6.4 ns duration ( 4.7M) |  d = 1.4 nm; 1.4 V / 10.2 nm; 5.8 ns total ( 3.8M) |
The figure above shows the position of the dsDNA CoM relative to the center of the silicon nitride membrane against time. Within the first few nanoseconds, the electric field drove dsDNA into the pores (movies: 1.4 nm pore, 2.0 nm pore); the wider pore facilitated faster translocation. Due to their conical shapes, both pores narrow toward the center of the membrane, which slowed DNA translocation. After about 4.5 ns, the translocation halted in both simulations before the DNA arrived at the narrowest part of the pores. The snapshots included in the inset illustrate the conformations of dsDNA at the end of these simulations. Notice that dsDNA traveled a longer path inside the wider pore suggesting that the translocation halts at a particular cross section. To ascertain if the translocation halted at the same cross section in both pores, we plot in the inset of the figure the local radius of the pore around the first DNA base pair. In both simulations, the translocation of dsDNA halted when the pore narrowed to 1.25 ± 0.1 nm radius (or 2.5 nm diameter). So, we conclude that pores with d < 2.5 nm are impermeable to dsDNA for fields < 1.3 V / 10 nm. This prediction has been confirmed by experiment ().
High electric fields can force dsDNA through pores impermeable at smaller fields
In order to determine if a higher electric field could drive dsDNA through the same pores, we continued our simulations applying a 6.5 V transmembrane bias. In the figure below, we plot the position of the dsDNA CoM against the simulation time. The results of these simulations suggest that dsDNA can permeate both pores at a sufficiently high voltage. In the case of a 2.0 nm diameter pore, the 6.5 V bias deformed the DNA helix, shifting one of the strands relative to the other by approximately one nucleotide, while preserving the hydrogen bonds between strands. Such stretching and shifting reduces the effective diameter of a double helix, allowing it to pass through the constriction of the pore without unzipping (movie). In the case of the 1.4-nm-diameter pore, 6.5 V unzipped dsDNA before it reached the narrowest part of the pore. After denaturing, one of the two strands passed through the 1.4 nm constriction, while the other strand remained at the same place where the unzipping occurred (movie).
 |  d = 2.0 nm; 6.5 V / 10.2 nm; 3.0 ns total ( 3.8M) |  d = 3.0 nm; 1.4 V / 10.2 nm; 18.9 ns total (17.3M) |  d = 1.4 nm; 6.5 V / 10.2 nm; 13.2 ns total (10.9M) |
In contrast, we found that dsDNA permeates a 3.0 nm radius pore at 1.3 V (the blue triangle trace in the figure above). Within the first 5 ns, the field drove dsDNA into the 3.0 nm diameter pore with a speed comparable to that inside the 1.4 nm and 2.0 nm pores (movie). In the 3.0 nm pore simulation, however, the translocation of DNA did not halt before reaching the center of the membrane. Instead, after about 11 ns, one end of the DNA helix passed through the 3.0 nm constriction. Shortly following that, this end adhered to the surface of silicon nitride on the other side of the pore (z < 0). Such surface adhesion of nucleosides is attributed to hydrophobic interaction between the DNA and nanopore and has been described in depth (). Driven by the field, the rest of the DNA helix continued the move through the pore, deforming the double helix of DNA into a loop (movie). A translocation like that was reported earlier ( see also movie).
Voltage threshold for translocation of dsDNA
To establish the threshold field required to drive dsDNA through the pore, we restarted our simulation of the 2.0 nm diameter pore from the conformation shown here. In the figure below we plot the dsDNA center-of-mass against time for a 1.3 (movie), 2.6 (movie), 3.2 (movie), 3.9 (movie) and 6.5 V (movie) bias. These results indicate that dsDNA permeates a 2.0 nm diameter pore for voltages > 2.6 V.
 |  d= 2.0nm; 1.3 V / 10.2 nm; 6.4 ns total; ( 4.7M) |  d= 2.0nm; 2.6 V / 10.2 nm; 8.0 ns total; ( 6.1M) |  d= 2.0nm; 3.2 V / 10.2 nm; 8.2 ns total; ( 8.5M) |  d= 2.0nm; 3.9 V / 10.2 nm; 13.4 ns total; (13.3M) |  d= 2.0nm; 6.5 V / 10.2 nm; 3.0 ns total; ( 3.8M) |
In all MD simulations, we observed partial unzipping of the DNA ends when they pass by the narrowest part of the pore. The length of the unzipped fragment was found to vary from one simulation to the other, but typically was from 2 to 12 nucleotides. The 3.9 V path in the figure is longer than the 3.2 V path because at 3.9 V, dsDNA partially unzipped before reaching the center of the membrane. After both DNA strands had passed through the center of the membrane (12.5 ns), the translocation at 3.9 V proceeded faster than that at 3.2 V, as indicated by the slopes of the curves. The existence of such voltage threshold and its magnitude for a 2.0 nm diameter pore were confirmed experimentally ().
Scaling of the voltage threshold
To discover the microscopic origin of the field threshold for dsDNA translocation, we carried out MD simulations of dsDNA translocations through a 2.0 nm diameter pore in both 10 and 20-nm thick membranes; the latter pore has an elliptic 1.8x2.2 nm2 cross-section in correspondence with the experiment carried out by our collaborator. The figure below shows the position of the DNA leading edge relative to the center of the membrane against the simulation time; the symbols identify simulations carried out at different biases. For both pores, we observed a voltage threshold for permeation of dsDNA that agrees quantitatively with experiment (). Although the average diameter of both pores is 2.0 nm, the cross-section of the pore in the 20 nm thick membrane is an ellipse. The major axis of the ellipse determines the effective diameter of the pore for permeation of dsDNA. Therefore, the scaling of the threshold voltages with the membrane thickness is slightly sublinear. Movies: 10 nm thick membrane and 1.3, 2.6, 3.2, 3.9, and 6.5 V bias; 20 nm thick membrane and 4, 5, 6, and 8 V bias.
 |  d = 2.0 nm; 4 V / 20 nm; 6.5 ns total ( 1.2M) |  d = 2.0 nm; 5 V / 20 nm; 6.2 ns total ( 1.5M) |  d = 2.0 nm; 6 V / 20 nm; 5.2 ns total ( 1.3M) |  d = 2.0 nm; 8 V / 20 nm; 4.4 ns total ( 945k) |
To further investigate the origin of this sharp voltage threshold, we plotted the electrostatic potential along the pore axis V(z) against the distance from the center of the membrane (z-zo) in a pore containing only electrolyte and no DNA for all simulation conditions studied (we have previously determined that taking DNA into account does not alter significantly the distribution of the electrostatic potential ). Scaling V(z) with the applied bias Vbias and (z-zo) with the membrane width Lmem converged all data to one universal curve (see panel (a) below). We find that the following expression:

V(z) / Vbias = 1/π Arctan(-b(z-zo) / Lmem)
approximates the variation of the electrostatic potential across the membrane, where the geometrical factor b was found to vary from 8 to 12 at 1M KCl. Fitting this function to all data points yielded b = 9.4. The scaled force acting on an elementary charge (q = 1.6×10⁻¹⁹) is plotted in the panel (b). The force drops off very abruptly away from the membrane center, which explains why the threshold for dsDNA permeation is so sharp. Thus, at a 1.3V bias, permeation of dsDNA halts when the pore narrows to 2.5 nm in diameter (figure); the force acting on the leading edge of DNA at that conformation is < 20 pN. At 2.6 V, the location of the DNA leading edge is closer to the membrane center than at 1.3V (figure); the force acting on the leading edge of DNA (about 45 pN), but still insufficient to stretch the helix. As the bias increases, the force eventually exceeds 60 pN, stretching DNA in the pore towards the membrane center. As the stretching proceeds, the force on the leading edge increases as (z-zo)2 so that once the DNA passes the threshold determined by the force acting on a leading edge of the molecule, it is unlikely to pull back from the pore. More details can be found in (, ).
approximates the variation of the electrostatic potential across the membrane, where the geometrical factor b was found to vary from 8 to 12 at 1M KCl. Fitting this function to all data points yielded b = 9.4. The scaled force acting on an elementary charge (q = 1.6×10⁻¹⁹) is plotted in the panel (b). The force drops off very abruptly away from the membrane center, which explains why the threshold for dsDNA permeation is so sharp. Thus, at a 1.3V bias, permeation of dsDNA halts when the pore narrows to 2.5 nm in diameter (figure); the force acting on the leading edge of DNA at that conformation is < 20 pN. At 2.6 V, the location of the DNA leading edge is closer to the membrane center than at 1.3V (figure); the force acting on the leading edge of DNA (about 45 pN), but still insufficient to stretch the helix. As the bias increases, the force eventually exceeds 60 pN, stretching DNA in the pore towards the membrane center. As the stretching proceeds, the force on the leading edge increases as (z-zo)2 so that once the DNA passes the threshold determined by the force acting on a leading edge of the molecule, it is unlikely to pull back from the pore. More details can be found in (
Influence of the solution pH on translocation of dsDNA

At low pH, atom N1 of nucleoside A and atom N3 of nucleoside C are likely to accept a proton from the solution, neutralizing the charge of the entire nucleotide. The pKa values of these protonation sites are about 3.8 and 4.5, respectively. The protonation of the nucleosides disrupts a delicate balance of the forces holding together the double helix; at very low pH, the helix denatures. At moderate pH (3-5), one can expect that only a fraction of A and C nucleosides is protonated, favoring, overall, the double helical organization of DNA, but altering physical properties of the helix, if compared to the pH 8.0 conditions. To investigate how these affect the electromechanics of DNA in a nanopore, we set up two MD simulations, in which all or a half of all A nucleotides in our 58bp helix were protonated. This effectively corresponds to a simulation carried out at pH4 (20% of all nucleosides de-protonated) and pH4.5 (10%), respectively. For the initial conformation of DNA we chose the final state from the 6.4ns simulation, in which a 1.3V bias drove dsDNA into a 2.0nm diameter pore (movie). We have previously established that, starting from this conformation, a 2.6 V bias cannot drive dsDNA through the pore at the pH8 conditions (figure). After adding protons to the selected nucleosides, we resumed simulations at a 2.6V bias. The results of the simulations are illustrated by the figure and three movies below.
 |  pH 8.0; d = 2.0 nm; 2.6 V / 10.2 nm; 8 ns total; ( 1.3M) |  pH 4.5; d = 2.0 nm; 2.6 V / 10.2 nm; 9.5 ns total; ( 1.6M) |  pH 4.0; d = 2.0 nm; 2.6 V / 10.2 nm; 26 ns total; ( 4.3M) |
Translocation of single stranded DNA (ssDNA) through Si3N4 pores
At a 1.4 V bias, we observed only a partial permeation of a 58-nucleotide ssDNA through a 1.4 nm diameter pore (movie). After 8 ns, the base of the leading nucleotide adheres to the surface of silicon nitride, dramatically slowing down the translocation. This simulation was continued applying, in addition to a 1.4 V bias, a traverse force that kept the leading nucleotide of ssDNA at the center of the pore (movie), resulting in a moderate increase of the translocation velocity. Next, we continued the simulation applying a 6.5 V bias (the bias force was switched off), during which the leading nucleotide of the DNA strand passed the pore constriction (movie). The bias was switched back to 1.4 V after 18 ns, causing a partial retraction of the strand from the pore (movie). Switching the bias back to 6.5 V forced DNA into a stretched conformation (movie). d=1.4 nm; 1.4 V / 10.2 nm; 17.6 ns total ( 9.6M) |  d=1.4 nm; 1.4 V / 10.2 nm; 2.8 ns total ( 1.7M) |  d=1.4 nm; 6.5 V / 10.2 nm; 18.0 ns total (11.2M) |  d=1.4 nm; 1.4 V / 10.2 nm; 5.3 ns total ( 3.4M) |  d=1.4 nm; 6.5 V / 10.2 nm; 14.8 ns total ( 8.6M) |
In addition to the driving electric force, three types of interactions affect the duration of the translocation: (i) mechanical friction between DNA and the pore; (ii) reduction of the driving force by the counter ion condensation, decreasing the DNA effective charge; and (iii) the hydrophobic adhesion of bases to the pore surface. On a time-scale of 10 ns, hydrophobic adhesion is the predominate force affecting the duration of the translocation of ssDNA and RNA strands when the diameter of the pore is larger than the diameter of the strand (, ).
Publications
Stretching DNA using an electric field in a synthetic nanopore. J. B Heng, A. Aksimentiev, C. Ho, P. Marks, Y. V. Grinkova, S. Sligar, K. Schulten, and G. Timp. Nano Letters, 5:1883-1888, 2005.The electromechanics of DNA in a synthetic nanopore. J. B. Heng, A. Aksimentiev, C. Ho, P. Marks, Y. V. Grinkova, S. Sligar, K. Schulten, and G. Timp. Biophysical Journal, 90:1098-1106, 2006.
Beyond the gene chip. J. B. Heng, A. Aksimentiev, C. Ho, V. Dimitrov, T. Sorsch, J. Miner, W. Mansfield, K. Schulten, and G. Timp. Bell Labs Technical Journal, 10:5-22, 2005.
Sizing DNA using a nanometer-diameter pore. J. B. Heng, C. Ho, T. Kim, R. Timp, A. Aksimentiev, Y. V. Grinkova, S. Sligar, K. Schulten, and G. Timp. Biophysical Journal, 87:2905-2911, 2004.
Microscopic kinetics of DNA translocation through synthetic nanopores. Aleksij Aksimentiev, Jiunn Benjamin Heng, Gregory Timp, and Klaus Schulten. Biophysical Journal, 87:2086-2097, 2004.
Investigators
Simulations_______________________________________________________________________________

BY THE USE OF SPECIFIC FREQUENCIES OF ELECTROMAGNETIC RADIATION WHICH MATCH THE RESONANCE FREQUENCIES OF THE DNA SECTION WHEN THE DNA SECTION IS CONSIDERED AS AN ELECTRICALLY CONDUCTIVE ANTENNA STRUCTURE
By Gary wade, Physicist, 12 / 29 / 02
OVERVIEW FOR THE LAYMAN - In this article the fact that the most common form of DNA ( B-DNA) is electrically conductive is used to show that viral, bacterial, and animal (human) DNA can be thought of and used as tuned "radio" antennas. For example by choosing the proper frequency of light to match a resonance frequency of the length of DNA in a virus, the oscillating electric field of the light can induce an electric current from the virus DNA ends (field emission). This field emission can damage the virus DNA end segments and surrounding protein structures and thereby make the virus non-infective. When considering human DNA gene sets as tuned antenna, specific frequencies in the microwave range can be used at relatively low power levels for short time intervals to open up specific gene sets. This allows for resetting of genetic age clocks (restoring telomeres on chromosome ends), reversal of some genetic defects, and total tissue repair (opening up some fetal gene sequences), even from traumatic damage such as amputations and brain and spinal cord damage. (Note: you can now print out the figures in Landscape mode--Ed 1/30)
THE TECHNICAL DETAILS
DNA when it is in the B–DNA form, the DNA form normally found in abundance in plants and animals, is known to be an electrical conductor along its core. It is not as good a conductor as a metal, more comparable to that of a semi-conductor or conductive polymer (ref. 1,2,3). This electrical conductivity allows us to consider a B–DNA strand of a fixed length as a "tuned" antenna. The length of the viral DNA is rather short, the great majority ranging from around 2,000 to 200,000 DNA base pairs in length, depending on the particular virus under consideration. Figure 1A illustrates a graphically linearized version of a very simple DNA virus, where the DNA length S has been chosen as the half wavelength (S = 1/2 Y) resonant antenna for an applied oscillating electromagnetic field of frequency (F). Figure 1B shows a more realistic graphical illustration of this simple virus where the DNA strand of length S is complexed with a protein coat in the form of a coil. The coiled DNA has both inductance and capacitance that will effect the resonant frequency and wave speed of/on the DNA coil. However, for our purposes the coiled B-DNA to a first approximation acts electrically essentially like a straight antenna of length S as depicted in Figure 1A. For our purposes, since the (LC) resonance phenomenon does not reduce the field emission, but only shifts the frequency at which it occurs at most efficiently, we will therefore ignore the inductance and capacitance of the virus coiled DNA. The applied resonant electric field (specific frequency of light), if of high enough intensity, will drive the DNA core electrons back and forth to a voltage / electric field amplitude at the DNA strand ends, such that electrons are emitted at the ends of the DNA by a process similar to the well known phenomenon of field emission from the surface of a metal point.
Field emission from a metal point is a very non-linear process in terms of the electric field (goes as the square of the electric field) and the electric field is approximately proportional to the inverse fourth power of the radius of curvature of the point of emission. The radius of curvature of the DNA conductive core is only ~ 3 angstroms and a relatively modest applied electromagnetic field intensity should, in a resonance situation, induce large amplitude electric fields at the DNA strand ends. Since the DNA core has a much lower density of conduction electrons than a metal core would have, the field emission probability of the emission (quantum tunneling) of an electron approaching the DNA strand end should significantly increase because there will be a greatly reduced image charge potential barrier. From these conditions we can surmise the strong possibility of substantial electron field emission from DNA strand ends under the above stated conditions. Furthermore, if these emitted electrons have acquired enough kinetic energy they can denature and/or destroy the chemical bonds of DNA coating proteins as well as disrupting any chemical structure in the local area. Also, in this protein damaging process, damage to the end DNA base pairs can be expected. In other words, a DNA strand exposed to its resonant electromagnetic frequency at adequate intensity should in short order become non-functional as a viable virus DNA to infect a host. This proposed phenomenon lends great support to some forms of light or color therapy, which have been persecuted by orthodox pharmaceutical driven allopathic medicine for eighty plus years now.
Equation 1 is the universal relationship between wavelength (Y), frequency (F), and wave propagation velocity (V) for all wave phenomenon.
V = Y F ; Equation 1.
For some wave phenomena V is frequency dependent. However, in our interested area it should be a near constant value. Considering the DNA strand of Figure 1A as a half wave antenna (S = Y/2) and putting Y in terms of S into equation 1 we obtain:
F = ( V ) / 2S ; Equation 2.
The DNA strand of Figure 1A could just as well have been considered as a full wave antenna (Y = S), a three half wave antenna ( Y = 2S / 3 ), a two wave antenna ( Y = S / 2 ), etc.. Equation 2 is a special case of the general equation describing the possible resonance frequencies that the DNA antenna can support, namely Equation 3.
F = NV / 2S ; where N = 1,2,3, … Equation 3.
Figures 2 A, B, C, and D illustrates N = 1, 2, 3, and 4 of equation 3, where the curves represent the boundary envelope for the maximum value that the oscillating voltage reaches at each point along the DNA strand. For example, consider the point C on the DNA strand of Figure 2A. In Figure 3, the voltage point C is plotted verses time for the situation depicted in Figure 2A. The plot of the voltage verses time for any point along the DNA strand looks like Figure 3, except the maximum amplitude varies from point to point. The voltage at a point on the DNA in one envelope oscillates 180 degrees out of phase with the voltage at a point in the adjacent envelope. If the DNA strand of Figures 2A, B, C, and D are exposed to "light" frequencies, which are somewhat off the resonance frequencies given by Equation 3, standing waves will still be formed on the DNA strand similar to those illustrated in Figures 2A, B, C, and D. However, the maximum voltage amplitude on the DNA ends will decrease significantly with increasing frequency shift off the resonance frequencies.
The virus illustrated in Figures 1A and Figure B are very simple and do not have the commonly observed lipid covered protein capsid coat of many common viruses that infect animals and plants. Just such a common virus is illustrated in Figure 4. The virus of Figure 4 looks a great deal different than the virus of Figure 1. However, to a first approximation it is only the length of the DNA segment that is dominate in determining the resonance frequency. The shape of the DNA strand is not too critical in most cases. An example of a good exception to this would be a lambda bacteriophage. In the lambda bacteriophage the DNA is very tightly packed under high compression into a many turned and layered coil which has significant inductance and capacitance. Also, the electrical conductivity could be significantly increased do to the high compression of and highly restricted movement of the lambda DNA in its capsid.
Let us use Equation 3 and some possibly reasonable values for V, S, and N to obtain approximate electromagnetic frequency ranges that could disrupt or destroy some virus. Let our virus of interest have a DNA strand of 20,000 DNA base pairs. The average length per base pair in B-DNA is 3.4 angstroms (an angstrom equals ten to the minus ten meters). This implies that the DNA strand length (S) is 6.8 microns. Let us guesstimate that V is .9 the speed of light.
Let N = 1, 2, 3, and 4. Then:
F = N ( 1.98 x 10 exp.13 sec.-1) , Equation 4.
F1 = 1.98 x 10 exp.13 sec.-1 ----------------------- Y1 = 15.113 microns
F2 = 3.97 x 10 exp.13 sec.-1 ----------------------- Y2 = 7.5565 microns
F3 = 5.95 x 10 exp.13 sec.-1 ------------------------ Y3 = 5.0377 microns
F4 = 7.94 x 10 exp.13 sec.-1 ----------------------- Y4 = 3.7783 microns
All of these resonance frequencies / wavelengths are in the infrared band range. If we had chosen a virus of 2,000 DNA base pairs, then the wavelengths would have been ten times smaller.
Y1 = 1.51 microns ( top of infrared band )
Y2 = .7556 microns ( Very top of infrared band )
Y3 = .5037 microns ( green light )
Y4 = .3778 microns ( bottom of ultraviolet band )
These results are potentially rather significant because there are many. many viruses that have DNA bases pair counts in the 2,000 to 20,000 and beyond range which cause serious health problems / diseases in people for which we currently have no viable treatments. We now have available tunable lasers, which can cover the top of the infrared band through the visible band into the ultraviolet band. These tunable lasers can be used to treat the blood directly or can be used in intense pulse scanning mode to treat the surface tissue and at depth in some cases. It is necessary to use a relatively narrow band of frequencies (specific color) to efficiently and effectively destroy the virus. If broad spectra light (i.e. white light) is used, the conduction electrons in the B-DNA core see the composite random oscillating electric field from all the different colors (frequencies) and will not form a strong resonant or near resonant electrical oscillation that is required to destroy the virus by the method discussed above. There are also very strong light sources commercially available, which produce frequency bands from the infrared through the ultraviolet. With appropriate filtering of these light sources, a viable whole body treatment modality can be envisioned. It is also conceivable to fire or cook into certain ceramics, certain molecules and mono atomic elements to obtain narrow band electromagnetic frequency emissions from the ceramics upon raising them to the appropriate temperature and then filtering out what is not wanted. It is even conceivable to "filter" infrared light from a very intense blackbody source to be used in treatment.
What we have been considering here for treatment on humans can of course be used on animals and plants in general. We can even imagine protecting one cell plants and animals as well as bacteria from viral attack by the use of specific frequencies of electromagnetic fields. Also, we may wish to wonder about finding the resonant frequencies for the chromosome DNA of certain bacteria. Can we disrupt or denature the chromosomal and or plasmid DNA of bacteria using resonant standing wave electromagnetic radiation? For example, imagine a bacterial plasmid that codes for an enzyme that destroys some anti-biotic. If this plasmid has a short electrically non-conductive segment such as Z-DNA, then the above used antenna formula can be used to destroy the plasmid. Imagine a small room (chamber) where a patient would stand in their nature suit bathed in all directions by a light as brilliant as the sun, but of only a very narrow frequency range (a specific color). Thirty seconds in the room and you go home just fine.
Now that you are familiar with the concept of various virus DNA lengths being treated as a tuned antenna, let us extend the concept to the chromosome size scale. Research has shown that the relaxed chromosome in the cell nucleus can be considered as a series of genes and gene sets sequences each gene set to be read all together or not at all. These gene sets are often separated/partitioned from each other by combinations of promoter and blocker proteins and or Z-DNA segments. Z-DNA is generally formed and maintained by the interaction between specific short DNA base pair sequences and certain ion complexes. Z-DNA is not electrically conductive and acts like an insulator separating two B-DNA conductors. Z-DNA effectively partitions chromosome B-DNA into a set of tuned antennas. Furthermore, the proteins that complex to the surface of the chromosome undoubtedly affect the electrical conductivity of that local B-DNA base pair sequence or region. In some cases the conductivity may increase and in others it may decrease. In some cases this B-DNA region may gain significant resistance even to the point of becoming effectively non-conductive. Also, at any one moment there are often many B-DNA transcription enzymes at work on a single chromosome transcribing gene sequences.
The transcription enzyme splits the DNA at its location into two separate single DNA base sequence strands during transcription and therefore stops electrical conductivity at this location. Figures 5 shows a small section of chromosome which illustrates the situation just described. So, it should be clear that the chromosomes could be considered as a set of both isolated and coupled tuned antennas as illustrated in Figure 6, where only the electrical properties of the chromosome are dwelt upon. The tuned antennas of the chromosome illustrated in Figure 6 are generally much longer in length than those of viruses and therefore have fundamental resonance frequencies considerably lower. Namely in the low gigahertz range. For example, when the cell phone companies say / claim that there is no scientific proof that cell phone use is harmful, they lie. It has been known since the 1960’s that R.F. in the 1 gigahertz range can cause chromosome damage and breakage. It was originally proposed to use this fact to study the phenomena of chromosome damage and breakage. The next time you use a cell phone ask yourself: Do I feel lucky ? Well, do you feel lucky? Well, do you?
There are potentially great benefits available from exposing animal cells to specific sets of microwave frequencies for brief time intervals at the appropriate intensities. Various gene sets can be opened up with phenomenal results. For example, resetting the telomere " time " clocks in cells giving people vastly extended youthfulness, reversing genetic diseases, and completely repairing massive body tissue damage such as spinal cord injuries, brain injuries, organ damage, and amputations. As bold as the above statements may seem, their truth or validity is easy to see when you consider a few facts and observations. First, consider fetal development, the fetus develops out of a fertilized egg in a totally genetically orchestrated/programmed fashion just like clockwork. Large numbers of gene sequences are expressed and then shut down usually not to be expressed again during the individual’s normal lifetime. Note that fetuses have been operated on in the womb, and when born have no scaring evident, i.e. complete tissue repair. This ability is shut down sometime before birth. Just as your development to birth is genetically programmed, your death is also. As you age with the need for continuous cell division for tissue repair and maintenance, you loose telomeres on the ends of each of the chromosomes of the dividing cells. As this process proceeds the length of the telomeres get shorter and shorter and the cell division rate continually decreases to the point that health can not be maintained and you die. Experimentally from tissue regeneration experiments done with salamanders and rats( Dr. Robert Becker’s work) it is known that amputated limbs of mammals can be re-grown (ref. 4). That is total tissue regeneration. Cells were made to become embryonic-like (de-differentiation) and then to multiply and then differentiate into all the needed body cell types to reform the missing amputated limb. In this process gene sequences that had been shut down to be never accessed again were opened up and expressed and apparently the chromosomes did not initially suffer telomere shorting.
Analyses of Becker’s work shows that it is the drastic change in the concentration of positively charged metal ion complexes in the cell cytoplasm surrounding the chromosomal DNA that causes the dedifferentiation of cell structure (ref. 5). In the re-growing of rat arms, it was the exposure of the cells at the amputation site to feeble negative electric currents that formed high hydroxyl ion concentrations around the amputation site, which attracted the positively charged metal ions into the region. This high hydroxyl ion concentration brought in high positive metal ion concentrations to mask the excess negative hydroxyl ion charge. Also, hydrogen ions were neutralized and chlorine ions were "forced" out of the region (significantly depleted). The cells in this region being bathed in a high PH and high positive metal ion concentration, are moved into another internal (cytoplasm) dynamic equilibrium positive metal ion concentration state in which the various positive metal ion concentrations are greatly increased and their concentration ratios significantly changed. These metal ion complexes interact with both DNA binding proteins and with specific ion complexes on specific DNA base pair sequences to either form and or undo Z-DNA short segments at the beginning of some gene sets. For the DNA reader enzymes to express the information in a gene sequence set it has to mount onto a specific promoter protein which is wrapped onto a specific sequence of B-DNA at the beginning of a gene sequence set. The promoter protein in turn needs the blocker protein which commonly share their binding DNA sequence site removed from the site, so as to allow the promoter protein to move to the proper exact DNA base pair sequence for the DNA reader enzyme mounting of the promoter protein and DNA transcription to begin. The blocker proteins are usually removed by other proteins sent from other gene sequences being read in the cell nucleus. If the promoter protein is being blocked by its needed specific base pair sequence being in the Z-DNA configuration, then this Z-DNA must be converted to the B-DNA configuration for the gene set transcription to begin.
So, we have a situation in which it is empirically known that positive metal ion concentrations in the cell nucleus can drastically alter the access and expression of gene sequence sets. Now how do these positive metal ion complexes, which interact / complex with: 1) DNA directly, 2) with negative ion complexes complexed with DNA, and 3) DNA’s complexed proteins, interact to open up specific gene sequence sets? Consider a Z-DNA sequence blocking the binding site of a promoter protein and therefore blocking DNA reader enzyme transcription activity. By significantly changing the ionic environment at the Z-DNA site, the Z-DNA can be converted to the B-DNA form and the promoter protein can move into the site and bind with it and then the reader enzyme can start transcription. One simple way to modify the ionic environment is to apply a significant oscillating electric field at the Z-DNA location. This is easily done by exposing the electrically conductive B-DNA segment, in which the Z-DNA is at one or both of the antenna end points of, to one of the antennas’ resonant frequencies. The oscillating voltage induced in the antenna will be at a maximum at the antenna ends, the Z-DNA location. Once the oscillating voltage/electric field strength at the antenna end goes over some minimum value it will be the dominate field determining ion concentrations in the region and whether or not ion complexes will complex with the Z-DNA. Specifically, an oscillating electric field suppresses complexing of ion complexes with DNA and therefore suppresses Z-DNA formation and opens up Z-DNA blocked gene sequence sets for transcription. Care must be taken not to build to strong of a resonant voltage/electric field on the antenna end region to avoid DNA damage. Similar oscillating voltage/electric field interactions between ion complexes, DNA sequences, and blocker proteins can be invoked to remove some blocker proteins and therefore start gene sequence transcription.
CONCLUSION: By the judicious use of various frequencies of electromagnetic energy we can destroy unwanted microbes, override genetic defects, control genetic expression in such a way as to effectively halt and reverse aging, and repair and regenerate the body totally, even form amputations and serve brain and spinal injuries. We are potentially at the start of a brave new world for medicine, biophysics, and biology (energy medicine, very few drugs required). Let us not let this technology be developed only by the military and the medical elite. Always remember: 1) The AMA is a monopolistic trade association interested in controlling/owning your illness care rights and your illness care money, 2) The pharmaceutical companies are not our friends and DO NOT HAVE OUR BEST INTERESTS AT HEART. THEIR GOD IS MONEY. AS LONG AS THEY CAN GET YOU TO TAKE THE SYMPTOM SUPPRESSING DRUG AND NOT TAKE CARE OF THE FUNDAMENTAL CAUSE OF YOUR PROBLEM, YOU WILL NEED TO KEEP GOING TO THEIR LICENSED DRUG DEALER (YOUR ALOPATHIC DOCTOR) AND SPEND YOUR MONEY. YOU ARE THEIR CASH COW. CAN YOU SAY MOO?
References:
1) Variable Range Hopping and Electrical Conductivity along the DNA Double Helix by Z. G. Yu and Xueyu Song, Physical Review Letters, 25, June 2001 Volume 86, Number 26.
2) Charge Transport along the Lambda DNA Double Helix, P. Tran, B. Alavi, and G. Grunen, Physical Review Letters, Volume 85, Number 7, Page 1564-1567.
3) DNA and Conducing Electrons, H. W. Fink, Visions and Reflections, Cell, Mol., Life Sci (CMLS), Volume 58, 2001, Page 1-3.
4) The Body Electric (Electromagnetism and the Foundation of Life), by Robert O. Becker, M.D., and Gary Selden, ISBN 0-688-06971-1.
5) A Physicist’s View of the Use of Feeble Electric Direct Currents To Repair Tissue and Replace Body Parts (Part One), by Gary Wade, Health Freedom News (The magazine of The National Health Federation, Monrovia, CA), February 1996, Page 22 – 33.
HOME
BACK TO ARTICLES PAGE
BACK TO SERVICES PAGE
RifeTech@Fastmail.fm
__________________________________________________________________________________

Methods for finding virus resonant frequency...
Via Patent:What is claimed is:
1. A method for determining therapeutic resonant frequencies of electromagnetic radiation for treating an animal or human infected with a disease caused by a pathogen, wherein said pathogen comprises a genomic material, the genomic material being surrounded by a medium, comprising: providing a frequency-emitting device; determining a velocity of the electromagnetic radiation through the medium surrounding the genomic material; determining the length of the genomic material; determining a first therapeutic resonant frequency to influence the genomic material in a first electromagnetic frequency range, by dividing the velocity of the electromagnetic radiation through the medium surrounding the genomic material by the length of the genomic material; dividing or multiplying the first therapeutic resonant frequency by a factor of a power of two, to obtain a second therapeutic resonant frequency to influence said genomic material, wherein the second therapeutic resonant frequency is in an electromagnetic frequency range capable of being emitted by the frequency-emitting device; programming the frequency-emitting device to emit the first, or the second resonant frequency; and treating the animal or human with the programmed resonant frequency intended to influence said genomic material, thereby rendering a therapeutic or desirable effect in the animal or human.
2. The method of claim 1, wherein determining the length of the genomic material comprises using the known spacing value between adjacent base pairs or bases, determining the number of base pairs or bases in the genomic material, and multiplying the number of base pairs or bases in the genomic material by the known spacing value between adjacent base pairs or bases.
3. The method of claim 1, wherein the medium surrounding the genomic material has electrical permittivity and magnetic permeability, wherein determining the velocity of the electromagnetic radiation through the medium surrounding the genomic material comprises relating the electrical permittivity and magnetic permeability to the velocity, wherein the velocity=1/ (.epsilon..mu.), where .epsilon. is the electrical permittivity of the medium, and .mu. is the magnetic permeability of the medium.
4. The method of claim 1, further comprising the steps of: dividing at least one of the previously calculated resonant frequencies by a positive integer to determine subharmonic frequencies, or multiplying at least one of the previously calculated resonant frequencies by a positive integer to determine harmonic frequencies; additionally programming the frequency-emitting device to emit one or more of the said subharmonic or harmonic frequencies, and treating the animal or human with one or more of the said subharmonic or harmonic frequencies.
5. The method of claim 4, wherein treating a human with the said first or second resonant frequency, or one of the said subharmonic or harmonic frequencies, comprises influencing said genomic material present in humans.
6. The method of claim 4, wherein treating an animal with the said first or second resonant frequency, or one of the said subharmonic or harmonic frequencies, comprises influencing said genomic material present in animals.
___________________________________________________________________________________

Resonance
These biophysicists classify the interaction of electromagnetic waves with biological matter into two categories:thermal and non-thermal. They have found in their experiments that microwaves in the 300 MEGAHERTZ(millions of cycles per second) to 3 GIGAHERTZ(billions of cycles per second) range of frequencies in the electromagnetic spectrum can be thermally absorbed by causing a dipolar molecule, such as water to oscillate in a frictional media, thereby dissipating the energy in the form of heat.
Nonthermal absorbtion of electromagnetic energy is reported to be far more obscure and controversial since it is thought to occur at relatively low levels of power(amplitude).
It has been demonstrated in some experiments among biophysicists that DNA moleucles can non-thermally absorb energy from microwaves partially because the DNA chains exihibit a phenomenon known as RESONANCE. All physical systems biological or otherwise have some sort of natural resonance at certain frequencies(resonant frquency). For instance a violin string has a natural resonant frequency that is directly related to it's lenth, mass(thickness), and it's tension. If plucked and left alone the violin string will quite readily vibrate that frequency until the energy it has aquired has been completely dissipated back out of the string. If the string is forced to vibrate at another frequency it will do so but without much enthusiasm. However when the driving frequency approaches the resonant frequency of the string the amplitude of the strings vibrations will increse manyfold and the string will resonate in harmony with the driving force.
The researchers in one particular experiment found that microwaves of around 3 gigahertz could resonantly drive a longitudinal vibration mode in dna chains by electrically coupling with ions residing on the backbone of the DNA helix.
In regards to energy absorbtion of the dna molecule as opposed to the solution that was used in some of these experiments researchers found(in one particular experiment) an absorbtion coefficient that was 400 times greater than the solvent alone at 11 gigahertz, when using a solution that contained a mixture of dna chain lengths.
RESONANCE.
When a force is applied repeatedly at the natural frequency of any system large amplitude oscillations result. This is the phenomenon known in physics as RESONANCE.
When a vibrating system is pushed or driven at the natural frequency of that system--RESONANCE occurs.

Biological FM signal maintains inflammation in cancer, asthma and other diseases
A study published tomorrow (10 April) in Science examines a key player in conditions such as cancer, inflammatory bowel disease, rheumatoid arthritis and asthma and has shown that cells use a sophisticated communication system to coordinate responses to infection and maintain inflammation in the body. This system is now a target for designing drugs to treat these conditions.Scientists funded by the Biotechnology and Biological Sciences Research Council (BBSRC), the Medical Research Council (MRC) and the Engineering and Physical Sciences Research Council (EPSRC) have combined biological experiments and mathematics to discover the secrets of NF-kappaB – a biological machine that coordinates the setting up and maintenance of inflammation in the body by broadcasting a signal to surrounding cells.
The team from the Universities of Liverpool, Manchester and Warwick, along with scientists from pharmaceutical company AstraZeneca (AstraZeneca R & D, Charnwood) have used Systems biology – a multidisciplinary approach that uses a combination of experimental and theoretical techniques to tackle biological problems – to investigate the role of NF-kappaB.
Professor Michael White of the University of Liverpool, who led the research said: "We know that successive peaks and troughs in the amount of NF-kappaB – forming a wave-like pattern over time – can exert exquisite control over many biological processes that underlie the symptoms of inflammation. Furthermore, what we now see is that different cell processes are determined once they pick up the frequency of peaks and troughs in the NF-kappaB signal, just like tuning in to an FM radio signal."
Professor Douglas Kell, BBSRC Chief Executive and co-author of the paper in his previous role added: "This research is an example that shows truly integrated systems biology allowing us to get right to the bottom of a complex and important biological question i.e. can we better understand the fundamental biology of inflammation in order to treat disease?
"The results of our work simultaneously aid and challenge drug designers; it will not simply be a matter of using a drug to knock down one key biological player in an inflammatory disease. This research tells us that cells in inflammatory tissues may use very precise timing to communicate between each other in order to determine the overall response to infection and the extent to which inflammation is maintained. Systems biology is enabling us to get a complete picture of the biology underpinning inflammation and thus pinpoint the potential axes of control that might be targeted with drugs."
###
ContactBBSRC Media Office
Nancy Mendoza, Tel: 01793 413355, email: nancy.mendoza@bbsrc.ac.uk
Matt Goode, Tel: 01793 413299, email: matt.goode@bbsrc.ac.uk
Notes to Editors
This work is published in the journal Science. For a copy of the paper please contact Natasha Pinol in the AAAS press office:
e-mail: npinol@aaas.org
Tel: +1 202-326-7088
About BBSRC
The Biotechnology and Biological Sciences Research Council (BBSRC) is the UK funding agency for research in the life sciences. Sponsored by Government, BBSRC annually invests around £420 million in a wide range of research that makes a significant contribution to the quality of life for UK citizens and supports a number of important industrial stakeholders including the agriculture, food, chemical, healthcare and pharmaceutical sectors. BBSRC carries out its mission by funding internationally competitive research, providing training in the biosciences, fostering opportunities for knowledge transfer and innovation and promoting interaction with the public and other stakeholders on issues of scientific interest in universities, centres and institutes.
The Babraham Institute, Institute for Animal Health, Institute of Food Research, John Innes Centre and Rothamsted Research are Institutes of BBSRC. The Institutes conduct long-term, mission-oriented research using specialist facilities. They have strong interactions with industry, Government departments and other end-users of their research.
For more information see: http://www.bbsrc.ac.uk
About MRC
The Medical Research Council is dedicated to improving human health through excellent science. It invests on behalf of the UK taxpayer. Its work ranges from molecular level science to public health research, carried out in universities, hospitals and a network of its own units and institutes. The MRC liaises with the Health Departments, the National Health Service and industry to take account of the public's needs. The results have led to some of the most significant discoveries in medical science and benefited the health and wealth of millions of people in the UK and around the world.
www.mrc.ac.uk